Network
Purpose: Use the igraph package (Nepusz and Tamas 2006) to calculate the shortest paths between rodents in the rodent ectoparasite network.
Load the packages and file.
library(dplyr)
library(igraph)
library(magrittr)
library(tidyverse)
library(reshape2)

rpairs <- read.csv("RodPar_ChileR3.csv", header= TRUE) # Pairs of rodents and ectoparasites
Create an igraph network from an adjacency matrix.
adj<-rpairs %>% #pairs of rodents and ectoparasites
  mutate(n = 1) %>% # new column with..
  spread(Rodent, n, fill=0) %>% #all rodents with the same parasites-type in one row with rodent as a header
  dplyr::select(-Parasite, -Type) %>% #Select the Parasite by Type (all types the same)
  {crossprod(as.matrix(.))} %>% #calculate the coccurences of each rodent connection by a Parasite
  `diag<-`(0)

g <- graph.adjacency(adj, mode="undirected") # use adjacency matrix to create graph

plot(g, vertex.label =NA, layout=layout_nicely) # a visual of the igraph network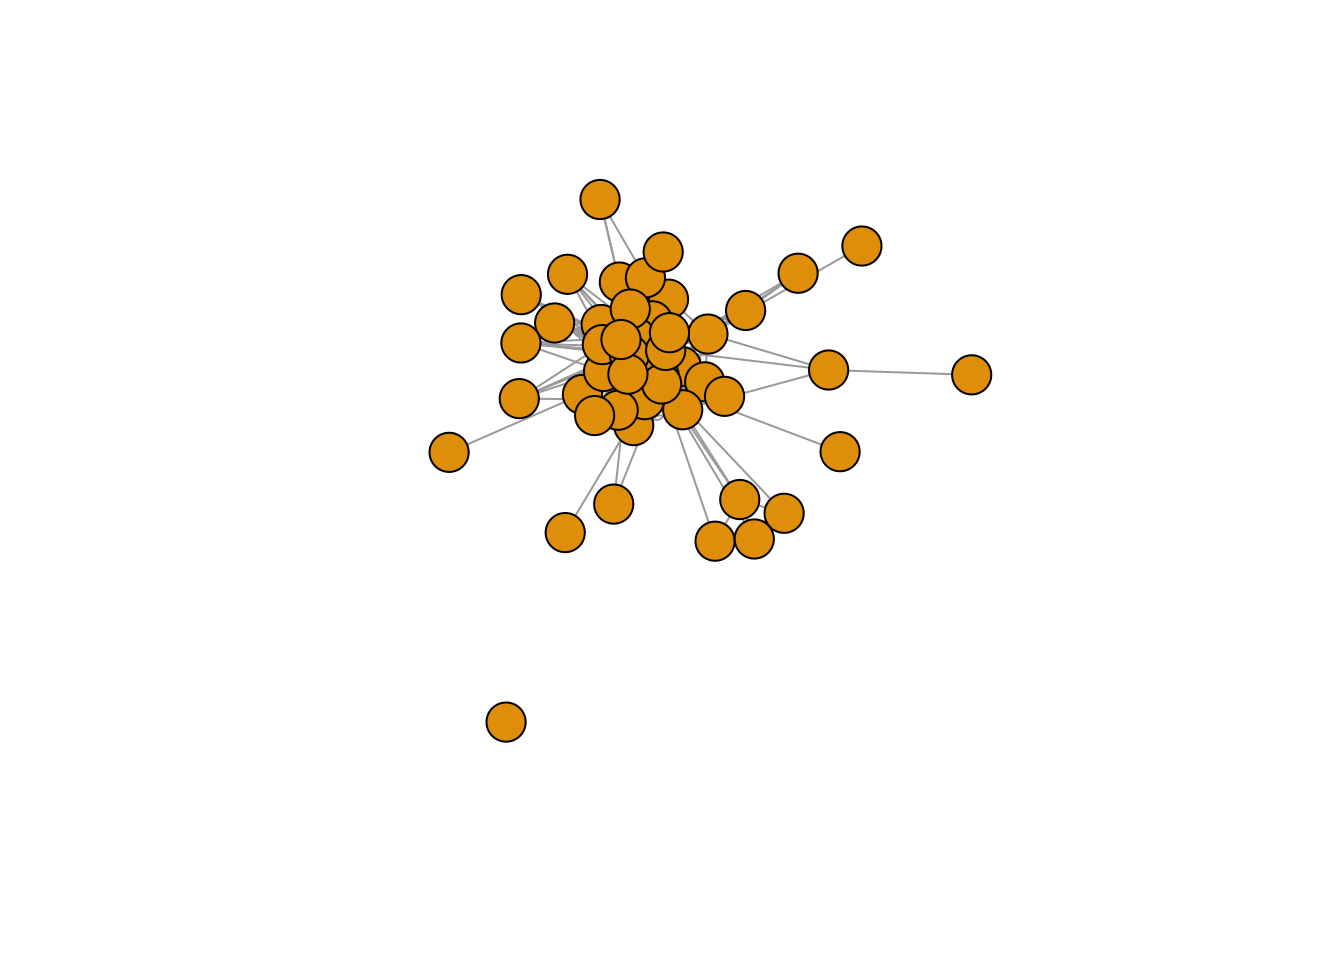
Use the igraph network to find the shortest paths between pairs of rodents (as a matrix) and save it as a file.
dist<- shortest.paths(g, v=V(g), to=V(g))#path matrix

print(dist[1:3,1:3]) #preview the matrix
## Abrocoma bennetti Abrocoma cinerea Abrothrix andinus
## Abrocoma bennetti 0 2 2
## Abrocoma cinerea 2 0 1
## Abrothrix andinus 2 1 0write.csv(dist, "PathMatrix.csv") #Will be used in Mantel TestsThis means that Abrocoma bennetti and Abrocoma cinerea need to go through 2 other rodents to be connected by ectoparasites. This file will be used later on with mantel tests to see how the network path length is correlated with range and phylogenetic distance.
Cited:
Nepusz, Gabor Csardi, and Tamas. 2006. “The Igraph Software
Package for Complex Network Research.” Journal Article.
InterJournal Complex Systems: 1695. https://igraph.org.